Note
This page was generated from a Jupyter Notebook. Download the notebook (.ipynb)
[1]:
# Skipped in CI: Colab/bootstrap dependency install cell.
Bruco: Bilinear Coupling and AM/FM Demodulation
![]()
Standard Bruco scans only detect linear coherence between DARM and auxiliary channels. Real interferometer noise often involves nonlinear coupling mechanisms that a linear scan misses entirely. This tutorial covers two common advanced patterns found in O4 commissioning data and distilled from the gwexpy usage catalog:
Bilinear coupling detection — build a synthetic witness
fast × slowand run Bruco on the extended channel set.Hilbert AM/FM demodulation — extract the instantaneous amplitude / frequency of a spectral line and correlate these slowly-varying envelopes with environmental sensors.
The physical question in both cases is the same: which slow environmental or control variable is modulating a higher-frequency feature seen in DARM, and how should we encode that hypothesis so Bruco can test it.
Prerequisites:
Setup
[2]:
import warnings
warnings.filterwarnings("ignore", category=UserWarning)
warnings.filterwarnings("ignore", category=DeprecationWarning)

# ruff: noqa: I001
import matplotlib.pyplot as plt
import numpy as np
from astropy import units as u
from scipy.signal import hilbert

from gwexpy.analysis import Bruco
from gwexpy.timeseries import TimeSeries, TimeSeriesDict
1. Mock Data Generation
We synthesize a DARM channel that contains two types of noise beyond the Gaussian floor:
Noise type |
Mechanism |
Signature |
|---|---|---|
Bilinear |
|
Sidebands around fast-channel frequency |
AM line |
|
30 Hz line whose amplitude fluctuates |
A linear Bruco scan will not detect bilinear coupling because the witness channels are individually incoherent with DARM — only their product is.
Common mistake: concluding that “no coherence” means “no coupling” after only the baseline scan. For bilinear problems, the failure of the linear witness is the expected diagnostic, not a negative result.
[3]:
rng = np.random.default_rng(0)

fs = 512          # sample rate [Hz]
T  = 128.0        # duration [s]
n  = int(fs * T)
t  = np.arange(n) / fs

# ------------------------------------------------------------------
# Independent physical sources
# ------------------------------------------------------------------
# 1. Broadband Gaussian noise — the "true" DARM floor
src_broad = rng.normal(0, 1, n)

# 2. A fast vibration source (e.g. PSL table accelerometer)
#    Contains a 116 Hz mechanical resonance driven broadband
src_fast = rng.normal(0, 1, n)   # broadband fast channel

# 3. A slow environmental drift (e.g. IMC alignment, thermal)
#    Bandwidth 0.1 – 5 Hz
src_slow_raw = rng.normal(0, 1, n)
from scipy.signal import butter, lfilter
b, a = butter(4, [0.1, 5], btype='band', fs=fs)
src_slow = lfilter(b, a, src_slow_raw)

# ------------------------------------------------------------------
# SCENARIO A: BILINEAR COUPLING
#   A fast vibration (116 Hz) is amplitude-modulated by the slow drift
#   and couples into DARM.
#   DARM_bilinear ~ src_fast * src_slow  (frequency-shifted sidebands)
# ------------------------------------------------------------------
BILINEAR_COUPLING = 0.6
darm_bilinear = BILINEAR_COUPLING * src_fast * src_slow

# ------------------------------------------------------------------
# SCENARIO B: AM-MODULATED LINE
#   A 30 Hz line (e.g. power harmonics) is amplitude-modulated
#   by the slow drift → instability visible in Hilbert amplitude
# ------------------------------------------------------------------
LINE_FREQ  = 30.0   # Hz
LINE_AMP   = 0.4
AM_DEPTH   = 0.5    # modulation index
carrier    = np.sin(2 * np.pi * LINE_FREQ * t)
envelope   = 1 + AM_DEPTH * src_slow / (np.std(src_slow) + 1e-10)
darm_am    = LINE_AMP * carrier * np.clip(envelope, 0, None)

# ------------------------------------------------------------------
# DARM = floor + bilinear noise + AM line
# ------------------------------------------------------------------
darm_raw = src_broad + darm_bilinear + darm_am

target = TimeSeries(
    darm_raw, dt=1/fs, unit=u.dimensionless_unscaled,
    name="K1:CAL-CS_PROC_DARM_STRAIN_DBL_DQ", t0=0,
)

# Auxiliary channels
# fast witness: correlated with src_fast (pure witness, no slow info)
witness_fast = TimeSeries(
    src_fast + 0.2 * rng.normal(0, 1, n),
    dt=1/fs, unit=u.dimensionless_unscaled,
    name="K1:PEM-ACC_PSL_TABLE_PSL1_Y_OUT_DQ", t0=0,
)
# slow witness: correlated with src_slow
witness_slow = TimeSeries(
    src_slow + 0.05 * rng.normal(0, 1, n),
    dt=1/fs, unit=u.dimensionless_unscaled,
    name="K1:IMC-MCI_PIT_OUT_DQ", t0=0,
)

aux_dict = TimeSeriesDict({
    witness_fast.name: witness_fast,
    witness_slow.name: witness_slow,
})

print(f"DARM   sample rate : {target.sample_rate}")
print(f"Duration           : {T} s")
print(f"Aux channels       : {list(aux_dict.keys())}")
DARM   sample rate : 512.0 Hz
Duration           : 128.0 s
Aux channels       : ['K1:PEM-ACC_PSL_TABLE_PSL1_Y_OUT_DQ', 'K1:IMC-MCI_PIT_OUT_DQ']
[4]:
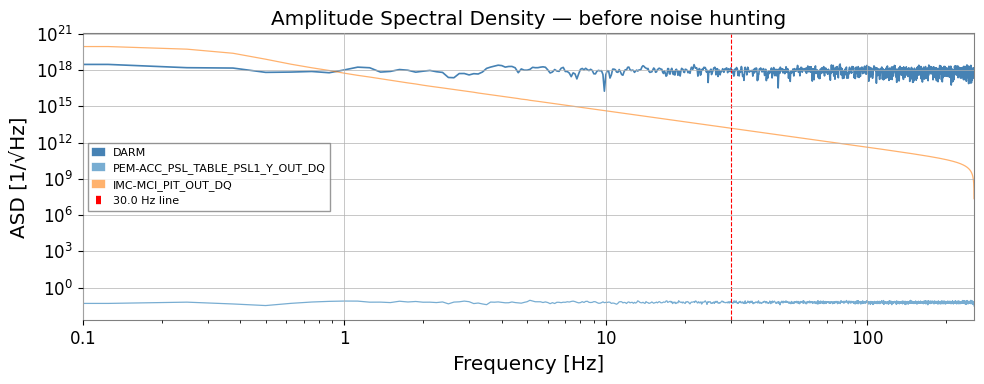
fig, ax = plt.subplots(figsize=(10, 4))
asd = target.asd(fftlength=8, overlap=4)
ax.loglog(asd.frequencies.value, asd.value, label="DARM", color="steelblue", lw=1.2)
for name, ts in aux_dict.items():
    a = ts.asd(fftlength=8, overlap=4)
    ax.loglog(a.frequencies.value, a.value, alpha=0.6, lw=0.9,
              label=name.split(":")[-1])
ax.axvline(LINE_FREQ, color="red",  ls="--", lw=0.8, label=f"{LINE_FREQ} Hz line")
ax.set_xlim(0.1, fs / 2)
ax.set_xlabel("Frequency [Hz]")
ax.set_ylabel("ASD [1/√Hz]")
ax.set_title("Amplitude Spectral Density — before noise hunting")
ax.legend(fontsize=8)
plt.tight_layout()
plt.show()
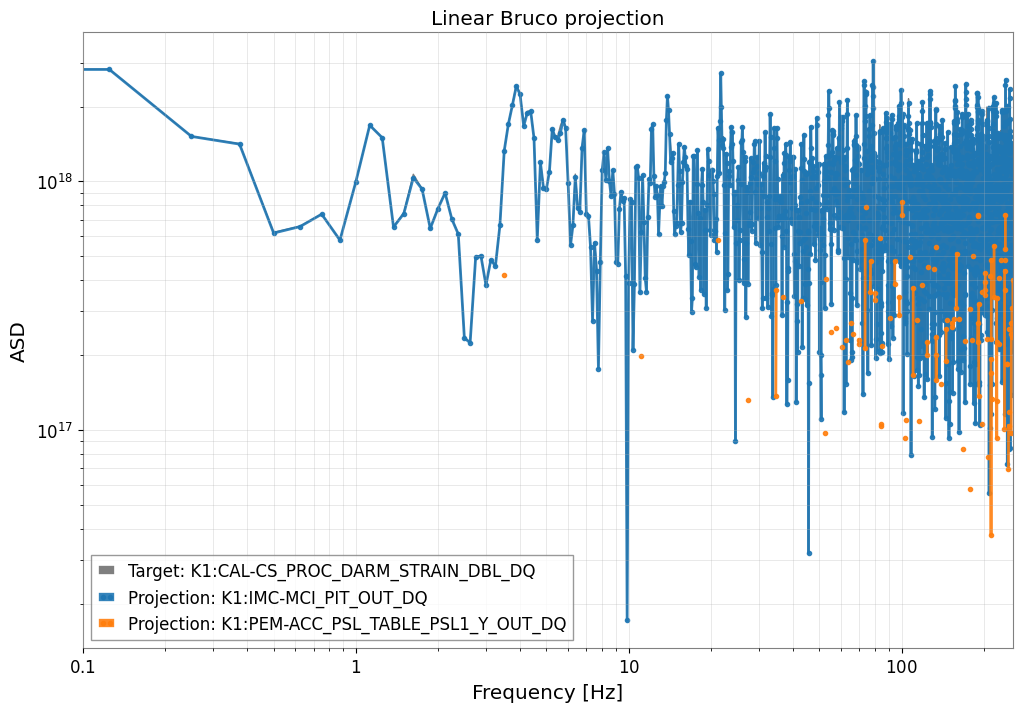
2. Linear Bruco Scan (Baseline)
Run the standard Bruco coherence scan with the two individual witnesses. The bilinear coupling between them and DARM should remain invisible here.
[5]:
bruco = Bruco(target_channel=target.name, aux_channels=[])

result_linear = bruco.compute(
    fftlength=8.0, overlap=4.0,
    target_data=target, aux_data=aux_dict,
    top_n=2,
)
print("Linear Bruco scan complete.")
result_linear.plot_projection(coherence_threshold=0.3)
plt.xlim(0.1, fs / 2)
plt.title("Linear Bruco projection")
plt.show()

df_linear = result_linear.to_dataframe(ranks=[0])
print("\nTop coherences (linear scan):")
print(df_linear.sort_values("coherence", ascending=False).head(10).to_string(index=False))
Linear Bruco scan complete.
Top coherences (linear scan):
 frequency  rank               channel  coherence   projection
    49.000     1 K1:IMC-MCI_PIT_OUT_DQ   0.999987 1.691310e+18
   241.875     1 K1:IMC-MCI_PIT_OUT_DQ   0.999975 1.162312e+18
   193.625     1 K1:IMC-MCI_PIT_OUT_DQ   0.999962 1.043952e+17
   200.875     1 K1:IMC-MCI_PIT_OUT_DQ   0.999919 1.092047e+18
    53.875     1 K1:IMC-MCI_PIT_OUT_DQ   0.999912 1.399128e+18
   108.000     1 K1:IMC-MCI_PIT_OUT_DQ   0.999904 1.332632e+18
    92.750     1 K1:IMC-MCI_PIT_OUT_DQ   0.999893 1.490317e+18
   170.250     1 K1:IMC-MCI_PIT_OUT_DQ   0.999892 8.576261e+17
   249.500     1 K1:IMC-MCI_PIT_OUT_DQ   0.999889 3.130930e+17
   114.000     1 K1:IMC-MCI_PIT_OUT_DQ   0.999872 8.098280e+17
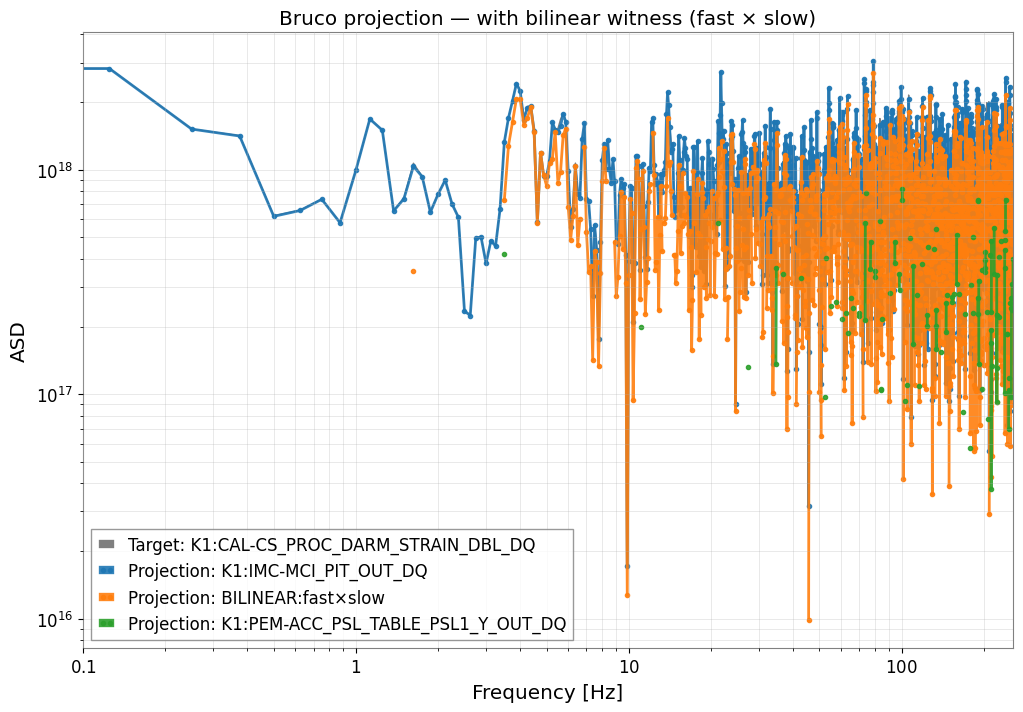
3. Bilinear Coupling Detection
Recipe (from O4b DARM-116 Hz and IMMT bilinear commissioning analyses):
fast_hp = witness_fast.highpass(10)       # strip DC / slow drift
slow_bp = witness_slow.bandpass(0.1, 5)   # keep only slow modulation
witness_bilinear = fast_hp * slow_bp      # synthetic bilinear witness
This synthetic channel mimics the product nonlinearity inside the interferometer. If DARM contains fast × slow, the bilinear witness will be highly coherent with it.
We then pass this extended channel set back to Bruco.compute().
Failure-prone pattern: using an overly broad slow-band or leaving DC trends in the fast witness. Both choices smear the product witness and often create impressive-looking but non-local coherence. Keep the slow witness tied to the modulation band you expect physically.
[6]:
# ------------------------------------------------------------------
# Build bilinear witness: fast × slow
# ------------------------------------------------------------------
fast_hp = witness_fast.highpass(10)    # remove DC / drift from fast channel
slow_bp = witness_slow.bandpass(0.1, 5) # keep only slow modulation band

witness_bilinear = fast_hp * slow_bp
witness_bilinear.name = "BILINEAR:fast×slow"

aux_extended = TimeSeriesDict({
    witness_fast.name:     witness_fast,
    witness_slow.name:     witness_slow,
    witness_bilinear.name: witness_bilinear,
})

result_bilinear = bruco.compute(
    fftlength=8.0, overlap=4.0,
    target_data=target, aux_data=aux_extended,
    top_n=3,
)
print("Bilinear-extended Bruco scan complete.")
result_bilinear.plot_projection(coherence_threshold=0.3)
plt.xlim(0.1, fs / 2)
plt.title("Bruco projection — with bilinear witness (fast × slow)")
plt.show()

df_bilinear = result_bilinear.to_dataframe(ranks=[0])
print("\nTop coherences (bilinear-extended scan):")
print(df_bilinear.sort_values("coherence", ascending=False).head(10).to_string(index=False))
Bilinear-extended Bruco scan complete.
Top coherences (bilinear-extended scan):
 frequency  rank               channel  coherence   projection
    49.000     1 K1:IMC-MCI_PIT_OUT_DQ   0.999987 1.691310e+18
   241.875     1 K1:IMC-MCI_PIT_OUT_DQ   0.999975 1.162312e+18
   193.625     1 K1:IMC-MCI_PIT_OUT_DQ   0.999962 1.043952e+17
   200.875     1 K1:IMC-MCI_PIT_OUT_DQ   0.999919 1.092047e+18
    53.875     1 K1:IMC-MCI_PIT_OUT_DQ   0.999912 1.399128e+18
   108.000     1 K1:IMC-MCI_PIT_OUT_DQ   0.999904 1.332632e+18
    92.750     1 K1:IMC-MCI_PIT_OUT_DQ   0.999893 1.490317e+18
   170.250     1 K1:IMC-MCI_PIT_OUT_DQ   0.999892 8.576261e+17
   249.500     1 K1:IMC-MCI_PIT_OUT_DQ   0.999889 3.130930e+17
   114.000     1 K1:IMC-MCI_PIT_OUT_DQ   0.999872 8.098280e+17
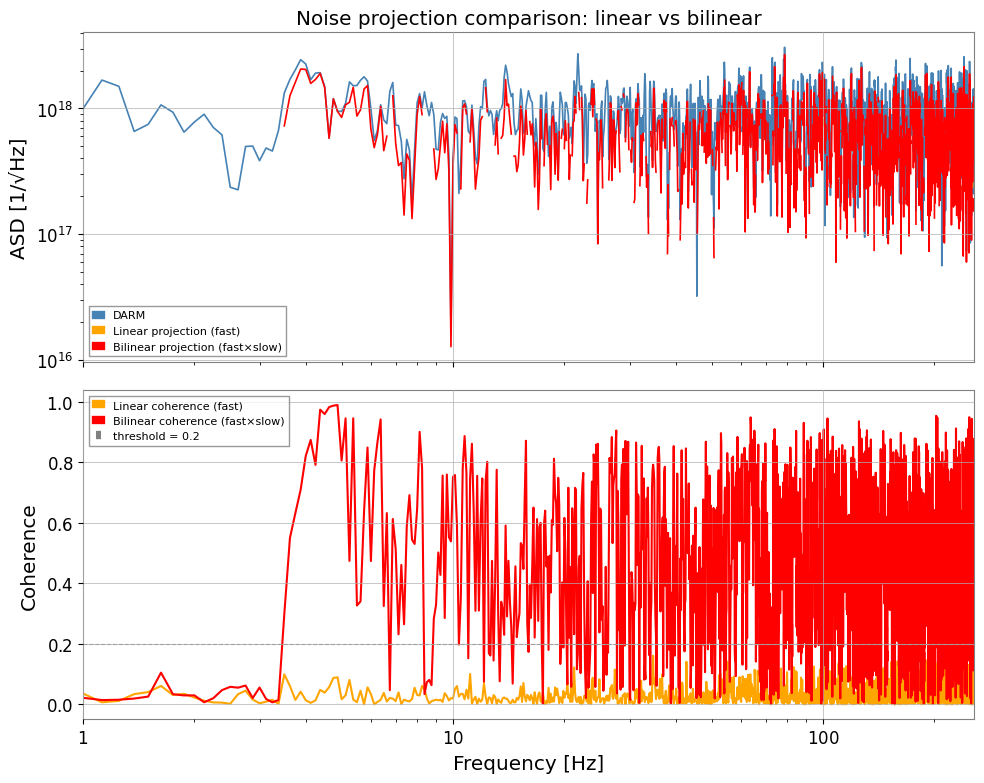
[7]:
# Compare DARM ASD vs bilinear projection
asd_darm = target.asd(fftlength=8, overlap=4)
fftlength = 8.0; overlap = 4.0

coh_lin  = target.coherence(witness_fast, fftlength=fftlength, overlap=overlap)
coh_bili = target.coherence(witness_bilinear, fftlength=fftlength, overlap=overlap)

proj_lin  = asd_darm * coh_lin ** 0.5
proj_bili = asd_darm * coh_bili ** 0.5

# Mask below threshold
THRESH = 0.2
proj_lin.value[coh_lin.value   < THRESH] = np.nan
proj_bili.value[coh_bili.value < THRESH] = np.nan

fig, axes = plt.subplots(2, 1, figsize=(10, 8), sharex=True)

axes[0].loglog(asd_darm.frequencies.value, asd_darm.value,
               color="steelblue", label="DARM", lw=1.2)
axes[0].loglog(proj_lin.frequencies.value, proj_lin.value,
               color="orange", label="Linear projection (fast)", lw=1.2)
axes[0].loglog(proj_bili.frequencies.value, proj_bili.value,
               color="red", label="Bilinear projection (fast×slow)", lw=1.2)
axes[0].set_ylabel("ASD [1/√Hz]")
axes[0].set_title("Noise projection comparison: linear vs bilinear")
axes[0].legend(fontsize=8)
axes[0].set_xlim(1, fs / 2)

axes[1].semilogx(coh_lin.frequencies.value,  coh_lin.value,
                 color="orange", label="Linear coherence (fast)")
axes[1].semilogx(coh_bili.frequencies.value, coh_bili.value,
                 color="red",    label="Bilinear coherence (fast×slow)")
axes[1].axhline(THRESH, color="gray", ls="--", lw=0.8, label=f"threshold = {THRESH}")
axes[1].set_xlabel("Frequency [Hz]")
axes[1].set_ylabel("Coherence")
axes[1].legend(fontsize=8)

plt.tight_layout()
plt.show()
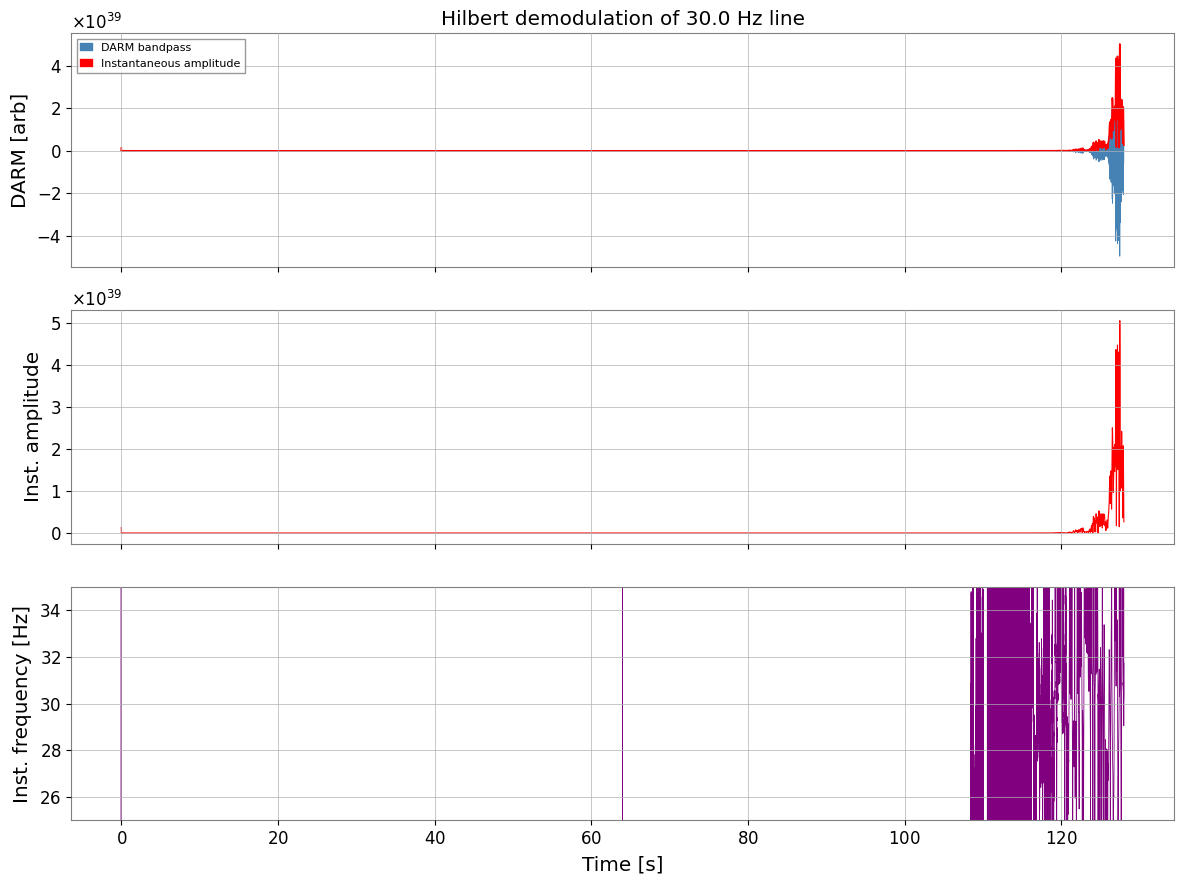
4. Hilbert AM/FM Demodulation
When a spectral line is amplitude- or frequency-modulated by a slow environmental perturbation, the line’s carrier frequency shows no direct coherence with the slow channel — but the envelope does.
Recipe (from O4c PEM injection shaker analyses):
darm_bp   = darm.bandpass(f_line - FW, f_line + FW)   # isolate the line
z         = scipy.signal.hilbert(darm_bp.value)         # analytic signal
inst_amp  = abs(z)                                       # amplitude envelope
inst_freq = diff(unwrap(angle(z))) / (2π Δt)            # instantaneous frequency
We then correlate inst_amp and inst_freq with slow auxiliary channels to identify what is driving the amplitude / frequency modulation.
Common mistake: correlating the raw carrier ASD with the slow witness and stopping there. AM/FM problems usually live in the envelope or instantaneous-frequency channel, not in the carrier bin itself.
[8]:
# ------------------------------------------------------------------
# Hilbert AM/FM demodulation of the DARM line at LINE_FREQ Hz
# ------------------------------------------------------------------
FW = 5.0   # half-bandwidth around the line [Hz]

# 1. Isolate the line with a bandpass filter
darm_bp = target.bandpass(LINE_FREQ - FW, LINE_FREQ + FW)

# 2. Analytic signal via Hilbert transform
z = hilbert(darm_bp.value)           # complex analytic signal
inst_amp_val  = np.abs(z)            # instantaneous amplitude (envelope)
inst_phs_val  = np.unwrap(np.angle(z))
# instantaneous frequency = d(phase)/dt / (2π)
dt = float(darm_bp.dt.value)
inst_freq_val = np.diff(inst_phs_val) / (2 * np.pi * dt)
# Pad to match length
inst_freq_val = np.append(inst_freq_val, inst_freq_val[-1])

inst_amp  = TimeSeries(inst_amp_val,  dt=dt, unit=u.dimensionless_unscaled, t0=0,
                       name="DARM_inst_amp")
inst_freq = TimeSeries(inst_freq_val, dt=dt, unit=u.Hz, t0=0,
                       name="DARM_inst_freq")

# 3. Quick check: plot amplitude envelope and instantaneous frequency
fig, axes = plt.subplots(3, 1, figsize=(12, 9), sharex=True)

axes[0].plot(darm_bp.times.value, darm_bp.value,   lw=0.5, color="steelblue",
             label="DARM bandpass")
axes[0].plot(inst_amp.times.value, inst_amp.value, lw=1.2, color="red",
             label="Instantaneous amplitude")
axes[0].set_ylabel("DARM [arb]")
axes[0].legend(fontsize=8)
axes[0].set_title(f"Hilbert demodulation of {LINE_FREQ} Hz line")

axes[1].plot(inst_amp.times.value, inst_amp.value, color="red", lw=0.8)
axes[1].set_ylabel("Inst. amplitude")

axes[2].plot(inst_freq.times.value, inst_freq.value, color="purple", lw=0.6)
axes[2].set_ylim(LINE_FREQ - FW, LINE_FREQ + FW)
axes[2].set_ylabel("Inst. frequency [Hz]")
axes[2].set_xlabel("Time [s]")

plt.tight_layout()
plt.show()
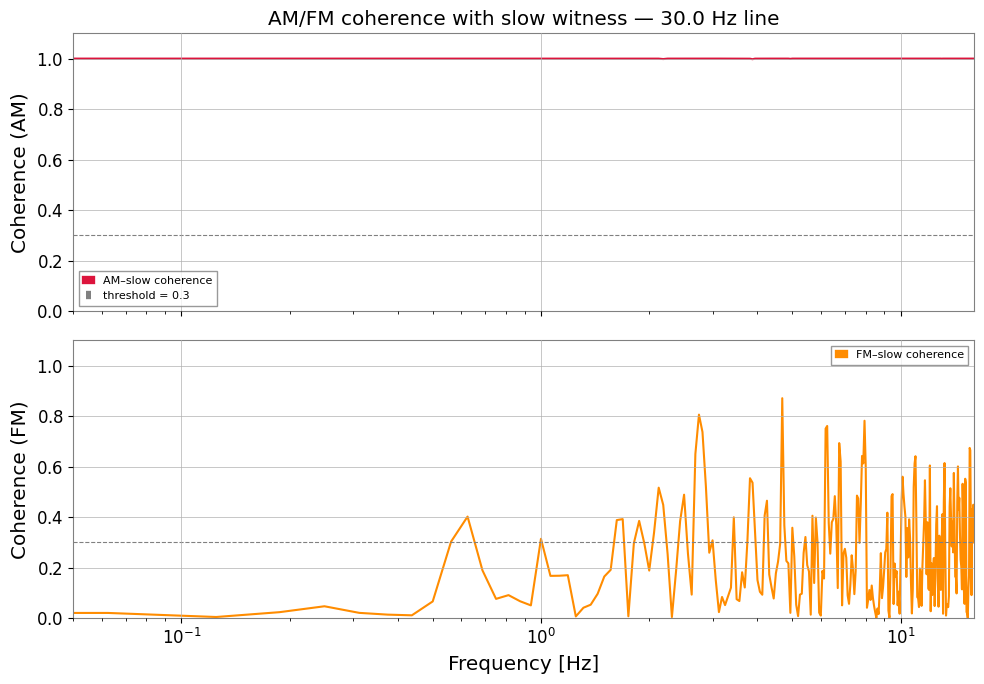
5. AM/FM Coherence with Slow Witnesses
The Hilbert envelope (inst_amp) and instantaneous frequency (inst_freq) have their own ASD in the modulation frequency range (0 – 5 Hz here). We compute coherence of these signals with slow environmental witnesses to identify the modulation source.
Failure mode to watch for: if the band-pass around the carrier is too wide, neighbouring lines leak into the analytic signal; if it is too narrow, the demodulated envelope is artificially suppressed. Tune the carrier window to isolate one physical line family.
[9]:
# ------------------------------------------------------------------
# Coherence of AM/FM signals with slow witness
# ------------------------------------------------------------------
# Resample to reduce computation (inst_amp modulation is slow)
RESAMP_FS = 32 # Hz — well above the 5 Hz modulation bandwidth
inst_amp_rs = inst_amp.resample(RESAMP_FS)
inst_freq_rs = inst_freq.resample(RESAMP_FS)
slow_rs = witness_slow.resample(RESAMP_FS)
fftlength_slow = 16.0; overlap_slow = 8.0
coh_am = inst_amp_rs.coherence(slow_rs, fftlength=fftlength_slow,
overlap=overlap_slow)
coh_fm = inst_freq_rs.coherence(slow_rs, fftlength=fftlength_slow,
overlap=overlap_slow)
fig, axes = plt.subplots(2, 1, figsize=(10, 7), sharex=True)
axes[0].semilogx(coh_am.frequencies.value, coh_am.value,
color="crimson", label="AM–slow coherence")
axes[0].axhline(0.3, color="gray", ls="--", lw=0.8, label="threshold = 0.3")
axes[0].set_ylabel("Coherence (AM)")
axes[0].set_title(f"AM/FM coherence with slow witness — {LINE_FREQ} Hz line")
axes[0].legend(fontsize=8)
axes[0].set_ylim(0, 1.1)
axes[1].semilogx(coh_fm.frequencies.value, coh_fm.value,
color="darkorange", label="FM–slow coherence")
axes[1].axhline(0.3, color="gray", ls="--", lw=0.8)
axes[1].set_ylabel("Coherence (FM)")
axes[1].set_xlabel("Frequency [Hz]")
axes[1].legend(fontsize=8)
axes[1].set_ylim(0, 1.1)
axes[1].set_xlim(0.05, RESAMP_FS / 2)
plt.tight_layout()
plt.show()
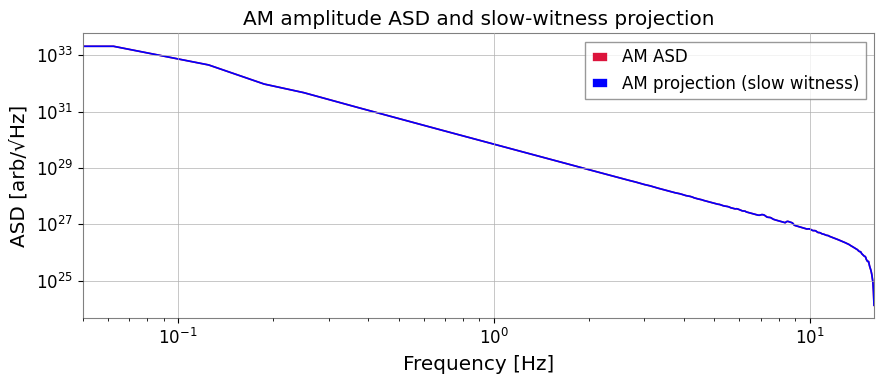
# ASD projection: how much of the line amplitude fluctuation is explained?
asd_am = inst_amp_rs.asd(fftlength=fftlength_slow, overlap=overlap_slow)
asd_am_proj = asd_am * coh_am ** 0.5
THRESH = 0.2
asd_am_proj.value[coh_am.value < THRESH] = np.nan
fig, ax = plt.subplots(figsize=(9, 4))
ax.loglog(asd_am.frequencies.value, asd_am.value,
color="crimson", label="AM ASD", lw=1.2)
ax.loglog(asd_am_proj.frequencies.value, asd_am_proj.value,
color="blue", label="AM projection (slow witness)", lw=1.2)
ax.set_xlim(0.05, RESAMP_FS / 2)
ax.set_xlabel("Frequency [Hz]")
ax.set_ylabel("ASD [arb/√Hz]")
ax.set_title("AM amplitude ASD and slow-witness projection")
ax.legend()
plt.tight_layout()
plt.show()
Summary
Step |
Tool |
Purpose |
|---|---|---|
Mock data |
Bilinear noise + AM line |
|
|
Baseline — misses nonlinear coupling |
|
|
Detect bilinear coupling |
|
|
Extract AM/FM from spectral line |
|
|
Identify modulation source |
Key takeaways
Linear Bruco is not sufficient when coupling has the form
DARM ≈ f_fast × f_slow. Building a syntheticfast × slowwitness restores coherence.Hilbert demodulation decouples the carrier (high frequency) from the modulation (low frequency), enabling coherence searches in the modulation band.
Both patterns require only
TimeSeriesarithmetic (*,.highpass(),.bandpass()) plusBruco.compute()— no additional gwexpy modules.Failure of the baseline linear scan is itself useful evidence when the expected physics is multiplicative or slowly modulated.
Next steps
Replace mock data with real NDS/GWF channels (
TimeSeries.read()).Extend the bilinear search to all
(ch_fast, ch_slow)pairs systematically.Combine with
Spectrogram.normalize(method='snr')to track amplitude modulation as a SNR spectrogram over time.
[10]:
print("=" * 68)
print("  Advanced Bruco Workflow Summary")
print("=" * 68)
rows = [
    ("1", "Mock data generation",
     "Bilinear noise + AM-modulated 30 Hz line"),
    ("2", "Linear Bruco scan",
     "Missed bilinear coupling (only direct coherence)"),
    ("3", "Bilinear witness: fast×slow",
     "ts_fast.highpass() * ts_slow.bandpass() → Bruco.compute()"),
    ("4", "Hilbert demodulation",
     "bandpass → hilbert() → inst_amp, inst_freq"),
    ("5", "AM/FM coherence scan",
     "inst_amp.coherence(slow) — identifies modulation source"),
]
print(f"  {'Step':<4}  {'Stage':<28}  {'Key operation'}")
print("-" * 68)
for step, stage, key in rows:
    print(f"  {step:<4}  {stage:<28}  {key}")
print("=" * 68)
====================================================================
  Advanced Bruco Workflow Summary
====================================================================
  Step  Stage                         Key operation
--------------------------------------------------------------------
  1     Mock data generation          Bilinear noise + AM-modulated 30 Hz line
  2     Linear Bruco scan             Missed bilinear coupling (only direct coherence)
  3     Bilinear witness: fast×slow   ts_fast.highpass() * ts_slow.bandpass() → Bruco.compute()
  4     Hilbert demodulation          bandpass → hilbert() → inst_amp, inst_freq
  5     AM/FM coherence scan          inst_amp.coherence(slow) — identifies modulation source
====================================================================