Segment Analysis: Visualization#
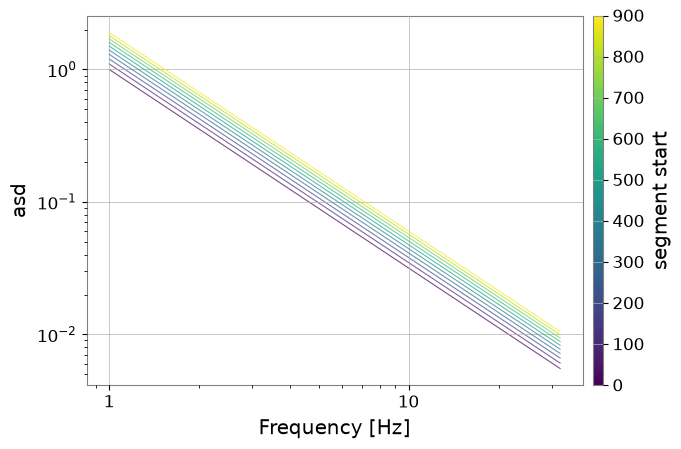
SegmentTable provides rich plotting features, specifically optimized for comparing spectra over multiple segments via overlay_spectra().
The segment boundaries are still gwpy.segments.Segment, and the spectra being overlaid are GWpy FrequencySeries objects. gwexpy adds the table-oriented visualization layer by collecting those GWpy base classes in SegmentTable and providing overlay, color grading, and overview layouts on top. For the base relationship between GWpy classes and gwexpy extensions, see SegmentTable: Basics.
import warnings


import warnings

with warnings.catch_warnings():

    import numpy as np
    np.random.seed(42)
    from gwpy.frequencyseries import FrequencySeries
    from gwpy.segments import Segment

    from gwexpy.table import SegmentTable

    def make_fs(i):
        f = np.linspace(1, 32, 256)
        data = (1.0/(f**1.5)) * (1.0 + i*0.1)
        return FrequencySeries(data, frequencies=f)

    segs = [Segment(i*100, i*100+100) for i in range(10)]
    st = SegmentTable.from_segments(segs, snr=np.random.uniform(5, 20, 10))
    st.add_series_column("asd", data=[make_fs(i) for i in range(10)], kind="frequencyseries")

    # 1. Overlay spectra graded by start time (default)
    plot = st.overlay_spectra("asd", color_by="t0")
    plot
/home/runner/micromamba/envs/gwexpy/lib/python3.11/site-packages/gwpy/time/_ligotimegps.py:42: UserWarning: Wswiglal-redir-stdio:

SWIGLAL standard output/error redirection is enabled in IPython.
This may lead to performance penalties. To disable locally, use:

with lal.no_swig_redirect_standard_output_error():
    ...

To disable globally, use:

lal.swig_redirect_standard_output_error(False)

Note however that this will likely lead to error messages from
LAL functions being either misdirected or lost when called from
Jupyter notebooks.

To suppress this warning, use:

import warnings
warnings.filterwarnings("ignore", "Wswiglal-redir-stdio")
import lal

  from lal import LIGOTimeGPS
Color Grading by Meta Column#
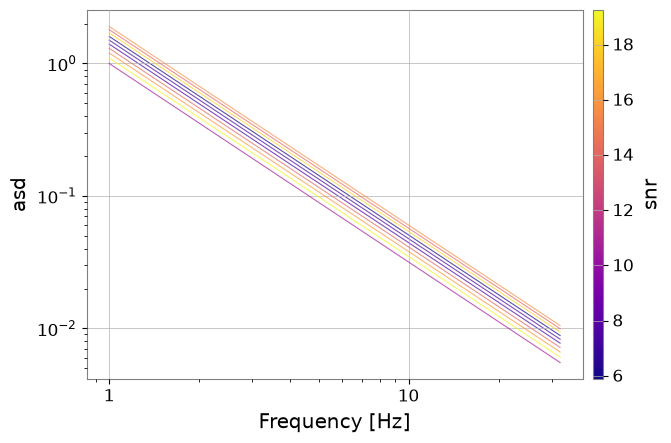
You can color individual lines based on any numeric meta column (e.g., SNR).
plot = st.overlay_spectra("asd", color_by="snr", cmap="plasma")
plot
Overview Layouts#
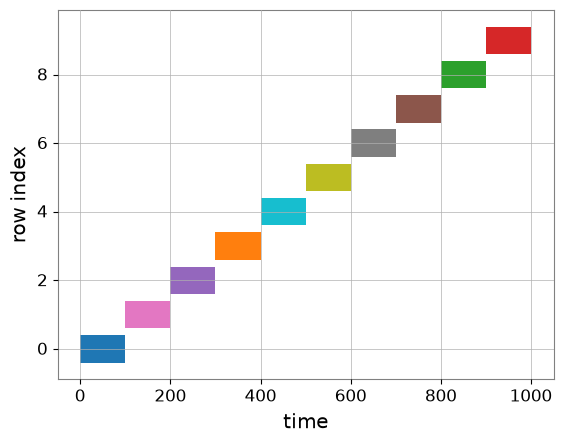
Use segments() to see the temporal layout of your table.
st.segments(color="snr")