セグメント解析: 可視化#
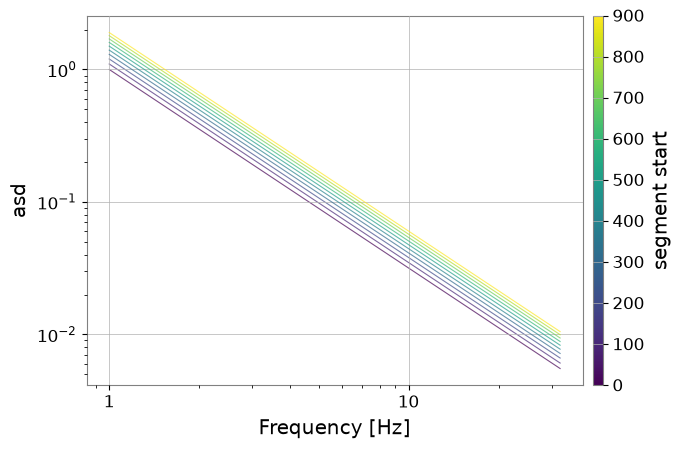
SegmentTable は豊富な描画機能を提供します。特に overlay_spectra() は、複数セグメント間のスペクトルを美しく比較するために最適化されています。
ここでも区間そのものは gwpy.segments.Segment、重ね描きするスペクトルは GWpy の FrequencySeries を使います。gwexpy はそれらの GWpy 基盤クラスを SegmentTable にまとめ、可視化や色分け、俯瞰レイアウトを表処理として追加しています。基礎関係は SegmentTable: 基本 を参照してください。
import warnings


import warnings

with warnings.catch_warnings():

    import numpy as np
    np.random.seed(42)
    from gwpy.frequencyseries import FrequencySeries
    from gwpy.segments import Segment

    from gwexpy.table import SegmentTable

    def make_fs(i):
        f = np.linspace(1, 32, 256)
        data = (1.0/(f**1.5)) * (1.0 + i*0.1)
        return FrequencySeries(data, frequencies=f)

    segs = [Segment(i*100, i*100+100) for i in range(10)]
    st = SegmentTable.from_segments(segs, snr=np.random.uniform(5, 20, 10))
    st.add_series_column("asd", data=[make_fs(i) for i in range(10)], kind="frequencyseries")

    # 1. Overlay spectra graded by start time (default)
    plot = st.overlay_spectra("asd", color_by="t0")
    plot
/home/runner/micromamba/envs/gwexpy/lib/python3.11/site-packages/gwpy/time/_ligotimegps.py:42: UserWarning: Wswiglal-redir-stdio:

SWIGLAL standard output/error redirection is enabled in IPython.
This may lead to performance penalties. To disable locally, use:

with lal.no_swig_redirect_standard_output_error():
    ...

To disable globally, use:

lal.swig_redirect_standard_output_error(False)

Note however that this will likely lead to error messages from
LAL functions being either misdirected or lost when called from
Jupyter notebooks.

To suppress this warning, use:

import warnings
warnings.filterwarnings("ignore", "Wswiglal-redir-stdio")
import lal

  from lal import LIGOTimeGPS
メタデータ列による色付け#
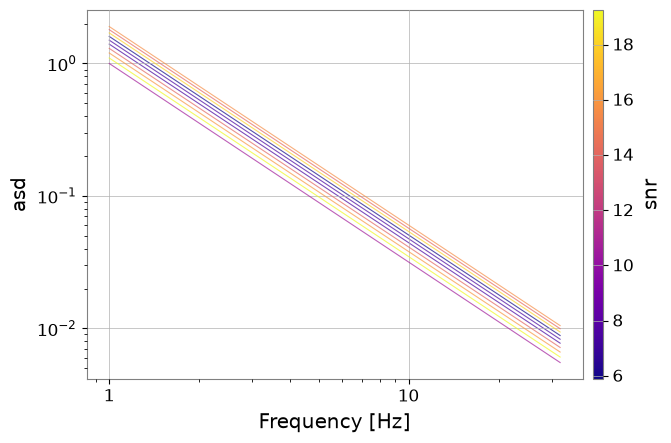
任意の数値メタデータ(例:SNR)に基づいて、各行のラインに色をつけることができます。
plot = st.overlay_spectra("asd", color_by="snr", cmap="plasma")
plot
俯瞰レイアウト#
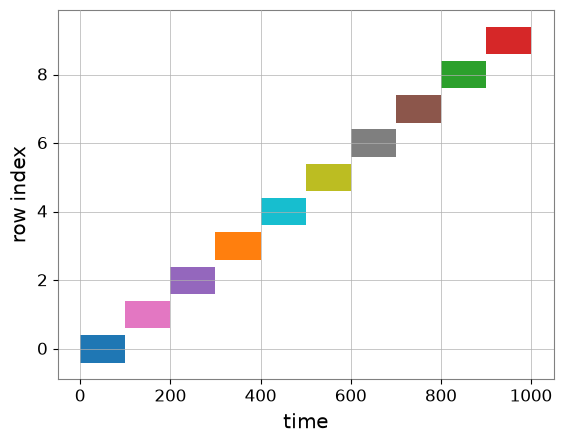
segments() を使用して、テーブルの時間的なレイアウトを確認します。
st.segments(color="snr")