
Map Plotting: Basics#
This notebook demonstrates how to use gwexpy.plot.SkyMap for all-sky HEALPix probability maps and gwexpy.plot.GeoMap for geographic maps of detector locations.
1. SkyMap: All-Sky Probability Maps#
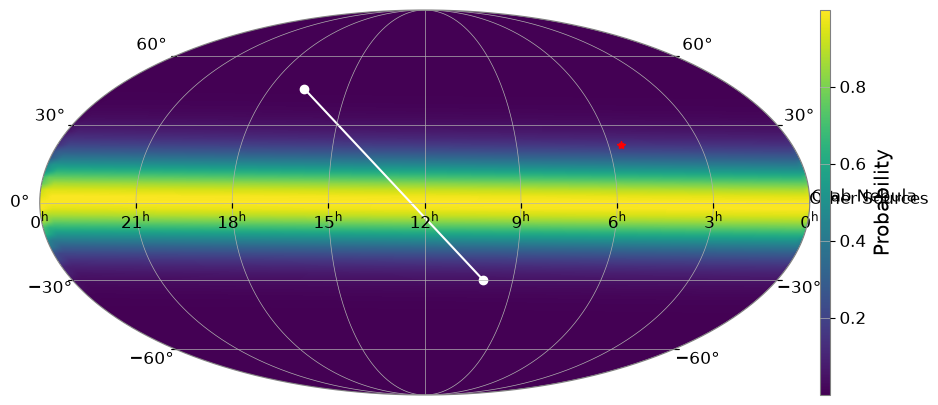
SkyMap is a specialized plotting class for displaying distributions on the celestial sphere. It integrates with ligo.skymap to easily handle HEALPix data.
import warnings


import matplotlib.pyplot as plt
import numpy as np

from gwexpy.plot import SkyMap

# Create SkyMap with Mollweide projection (default)
fig = SkyMap(figsize=(10, 5), projection="astro hours mollweide")

# Add synthetic HEALPix data if ligo.skymap is available
try:
    import ligo.skymap

    _ = ligo.skymap
    nside = 16
    npix = 12 * nside**2
    # Generate a dummy central peak
    map_data = np.exp(-0.5 * (np.arange(npix) - npix // 2) ** 2 / (npix // 10) ** 2)
    fig.add_healpix(map_data, cmap="viridis")
except ImportError:
    print("ligo.skymap not installed.")

# Mark some astronomical targets
# Crab Nebula (RA: 83.63 deg, Dec: 22.01 deg)
fig.mark_target(83.63, 22.01, label="Crab Nebula", color="red", marker="*")

# Other targets
fig.mark_target([150, 250], [-30, 45], label="Other Sources", color="white", marker="o")

plt.show()
/home/runner/micromamba/envs/gwexpy/lib/python3.11/site-packages/tqdm/auto.py:21: TqdmWarning: IProgress not found. Please update jupyter and ipywidgets. See https://ipywidgets.readthedocs.io/en/stable/user_install.html
  from .autonotebook import tqdm as notebook_tqdm
2. GeoMap: Geographic Maps with PyGMT#
GeoMap provides a Cartopy-like interface to PyGMT, allowing for high-quality geographic maps and easy placement of gravitational wave detectors.
# Create GeoMap with Robinson projection centered on 135E (Japan)
try:
    from gwexpy.plot import GeoMap

    gmap = GeoMap(projection="Robinson", center_lon=135)

    # Add map features
    gmap.add_coastlines(resolution="low", color="black")
    gmap.fill_continents(color="wheat")
    gmap.fill_oceans(color="lightblue")

    # Plot standard detectors (KAGRA, LIGO, Virgo, GEO)
    for det in ["K1", "H1", "L1", "V1", "G1"]:
        gmap.plot_detector(det, label=True)

    # Plot an arbitrary point
    gmap.plot(x=170.5, y=-23.6, marker="o", color="purple", markersize=12)

    gmap.show()
except ImportError as e:
    print(e)
except Exception as e:
    print(f"An error occurred: {e}")
    raise
pygmt is required for GeoMap. Install with: pip install pygmt (details: Error loading GMT shared library at 'libgmt.so'.
libgmt.so: cannot open shared object file: No such file or directory)
3. Close-up View of Japan Region#
In GeoMap, you can automatically zoom in to a specific country region by specifying an ISO 3166-1 alpha-2 country code (such as ‘JP’, ‘US’, etc.) in the region argument.
You can also add a scale bar to the map using add_scale_bar().
try:
    from gwexpy.plot import GeoMap

    # Display Japan region (specify region='JP')
    # Use Mercator projection for zoomed view, with detailed frame annotations (frame='afg')
    geo_jp = GeoMap(projection="Mercator", region="JP", frame="afg")

    geo_jp.fill_oceans(color="azure")
    geo_jp.fill_continents(color="lightgray")
    geo_jp.add_coastlines(resolution="medium")  # Draw coastlines with higher resolution

    # Plot KAGRA detector
    geo_jp.plot_detector("K1")

    # Add scale bar (500km width, at bottom-left with 0.5cm offset)
    geo_jp.add_scale_bar(width="500k", position="jBL", offset="0.5c/0.5c")

    geo_jp.show()
except ImportError as e:
    print(e)
except Exception as e:
    print(f"An error occurred: {e}")
    raise
pygmt is required for GeoMap. Install with: pip install pygmt (details: Error loading GMT shared library at 'libgmt.so'.
libgmt.so: cannot open shared object file: No such file or directory)
Commonly Used ISO Country Codes (alpha-2)#
Country |
ISO Code |
Notes |
|---|---|---|
Japan |
|
Location of KAGRA |
United States |
|
Location of LIGO (Hanford, Livingston) |
Italy |
|
Location of Virgo |
Germany |
|
Location of GEO600 |
India |
|
LIGO-India under construction |
Australia |
|
|
United Kingdom |
|