
マッププロット: 基本#
このノートブックでは、全天 HEALPix 確率マップに gwexpy.plot.SkyMap を使用する方法と、検出器の位置の地理マップに gwexpy.plot.GeoMap を使用する方法を説明します。
1. SkyMap: 全天確率マップ#
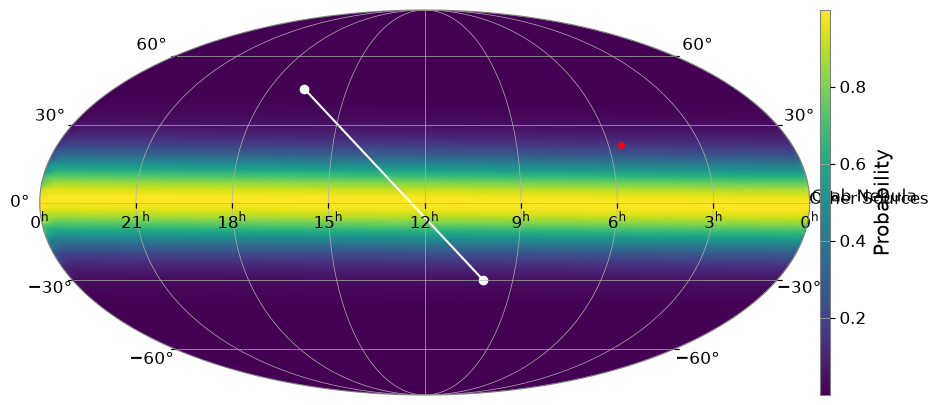
SkyMap は、天球上の分布を表示するための特殊なプロットクラスです。ligo.skymap と連携して、HEALPix データを簡単に処理できます。
import warnings


import matplotlib.pyplot as plt
import numpy as np

from gwexpy.plot import SkyMap

# Create SkyMap with Mollweide projection (default)
fig = SkyMap(figsize=(10, 5), projection="astro hours mollweide")

# Add synthetic HEALPix data if ligo.skymap is available
try:
    import ligo.skymap

    _ = ligo.skymap
    nside = 16
    npix = 12 * nside**2
    # Generate a dummy central peak
    map_data = np.exp(-0.5 * (np.arange(npix) - npix // 2) ** 2 / (npix // 10) ** 2)
    fig.add_healpix(map_data, cmap="viridis")
except ImportError:
    print("ligo.skymap not installed.")

# Mark some astronomical targets
# Crab Nebula (RA: 83.63 deg, Dec: 22.01 deg)
fig.mark_target(83.63, 22.01, label="Crab Nebula", color="red", marker="*")

# Other targets
fig.mark_target([150, 250], [-30, 45], label="Other Sources", color="white", marker="o")

plt.show()
/home/runner/micromamba/envs/gwexpy/lib/python3.11/site-packages/tqdm/auto.py:21: TqdmWarning: IProgress not found. Please update jupyter and ipywidgets. See https://ipywidgets.readthedocs.io/en/stable/user_install.html
  from .autonotebook import tqdm as notebook_tqdm
2. GeoMap:PyGMT による地理地図#
GeoMap は PyGMT への Cartopy 風インターフェースを提供し、高品質な地理地図と重力波検出器の簡単な配置を可能にします。
# Create GeoMap with Robinson projection centered on 135E (Japan)
try:
    from gwexpy.plot import GeoMap

    gmap = GeoMap(projection="Robinson", center_lon=135)

    # Add map features
    gmap.add_coastlines(resolution="low", color="black")
    gmap.fill_continents(color="wheat")
    gmap.fill_oceans(color="lightblue")

    # Plot standard detectors (KAGRA, LIGO, Virgo, GEO)
    for det in ["K1", "H1", "L1", "V1", "G1"]:
        gmap.plot_detector(det, label=True)

    # Plot an arbitrary point
    gmap.plot(x=170.5, y=-23.6, marker="o", color="purple", markersize=12)

    gmap.show()
except ImportError as e:
    print(e)
except Exception as e:
    print(f"An error occurred: {e}")
    raise
pygmt is required for GeoMap. Install with: pip install pygmt (details: Error loading GMT shared library at 'libgmt.so'.
libgmt.so: cannot open shared object file: No such file or directory)
3. 日本周辺のクローズアップ表示#
GeoMap では、region 引数に ISO 3166-1 alpha-2 国コード('JP', 'US' など)を指定することで、その国周辺を自動的にクローズアップして表示できます。 また、add_scale_bar() を使うことで、地図上に縮尺バーを追加できます。
try:
    from gwexpy.plot import GeoMap

    # Display Japan region (specify region='JP')
    # Use Mercator projection for zoomed view, with detailed frame annotations (frame='afg')
    geo_jp = GeoMap(projection="Mercator", region="JP", frame="afg")

    geo_jp.fill_oceans(color="azure")
    geo_jp.fill_continents(color="lightgray")
    geo_jp.add_coastlines(resolution="medium")  # Draw coastlines with higher resolution

    # Plot KAGRA detector
    geo_jp.plot_detector("K1")

    # Add scale bar (500km width, at bottom-left with 0.5cm offset)
    geo_jp.add_scale_bar(width="500k", position="jBL", offset="0.5c/0.5c")

    geo_jp.show()
except ImportError as e:
    print(e)
except Exception as e:
    print(f"An error occurred: {e}")
    raise
pygmt is required for GeoMap. Install with: pip install pygmt (details: Error loading GMT shared library at 'libgmt.so'.
libgmt.so: cannot open shared object file: No such file or directory)
よく使われる ISO 国コード (alpha-2)#
国名 |
ISO コード |
注意事項 |
|---|---|---|
日本 |
|
KAGRA が所在 |
アメリカ合衆国 |
|
LIGO (Hanford, Livingston) が所在 |
イタリア |
|
Virgo が所在 |
ドイツ |
|
GEO600 が所在 |
インド |
|
LIGO-India 建設予定 |
オーストラリア |
|
|
イギリス |
|