
長期トレンドを解析して状態変化を見つける#
重力波検出器サブシステムの継続的監視では、24〜48時間にわたる低速サンプリングのセンサ記録(温度計、地震計、真空計など)を処理します。目的は、データ欠損を適切に処理しながら、ゆっくりとした日周ドリフト、短時間の過渡パルス、および持続的なステップ状状態変化を正確に識別することです。
このチュートリアルで達成できること:
日周ドリフト、過渡パルス、状態変化、データ欠損を含む48時間・4チャンネルの低速センサデータセットを生成します。
欠損データをまたいで補間することなく、連続する有効セグメントのみを用いて低域通過基線を推定します。
残差系列上の正の過渡パルスと、標本間差分に基づくステップ状の遷移を検出します。
ギャップ処理ポリシーを検証し、単位情報を付加した構造化イベントカタログを出力します。
インライン図面を表示し、すべての必須メトリクスを検証します。
データ種別: 合成センサ電圧記録(48時間、サンプリング周期 dt=60秒)。
環境のセットアップ#
import json
import os
import platform
import tempfile
from pathlib import Path

from IPython.display import display
import matplotlib.pyplot as plt
import numpy as np
import pandas as pd
from astropy import units as u
from scipy import signal

import gwexpy
from gwexpy.timeseries import TimeSeries, TimeSeriesDict

# Define output directory for artifacts
output_dir_env = os.environ.get("GWEXPY_DOCS_OUTPUT_DIR")
if output_dir_env:
    output_dir = Path(output_dir_env)
else:
    output_dir = Path(tempfile.mkdtemp(prefix="gwexpy-t1-"))
output_dir.mkdir(parents=True, exist_ok=True)
(output_dir / "tables").mkdir(exist_ok=True)
(output_dir / "figures").mkdir(exist_ok=True)
print(f"Artifacts will be written to: {output_dir}")
Artifacts will be written to: /tmp/gwexpy-t1-51uqh16_
データ契約と合成データの生成#
# 48 hours, dt=60s -> 2880 samples/channel
duration_s = 48 * 3600
dt_s = 60.0
n_samples = int(duration_s / dt_s)
gps_t0 = 1400000000.0

time_indices = np.arange(n_samples)
time_hours = (time_indices * dt_s) / 3600.0

rng = np.random.default_rng(2026091601)

# SYN:TREND_A: drift + 24h sine + pulses at 8h and 32h
drift_A = 0.05 * (time_hours / 48.0)
diurnal_A = 0.2 * np.sin(2 * np.pi * time_hours / 24.0)
noise_A = rng.normal(0, 0.005, n_samples)
pulse_A = np.zeros(n_samples)
pulse_A[int(8 * 3600 / dt_s)] = 0.8
pulse_A[int(32 * 3600 / dt_s)] = 0.8
val_A = drift_A + diurnal_A + pulse_A + noise_A

# SYN:TREND_B: drift + 24h sine + pulses at 16h and 40h
rng_B = np.random.default_rng(2026091602)
drift_B = -0.03 * (time_hours / 48.0)
diurnal_B = 0.15 * np.cos(2 * np.pi * time_hours / 24.0)
noise_B = rng_B.normal(0, 0.005, n_samples)
pulse_B = np.zeros(n_samples)
pulse_B[int(16 * 3600 / dt_s)] = 0.8
pulse_B[int(40 * 3600 / dt_s)] = 0.8
val_B = drift_B + diurnal_B + pulse_B + noise_B

# SYN:STATE: steps at 12h (+0.6V) and 36h (-0.6V)
val_STATE = np.zeros(n_samples)
val_STATE[time_hours >= 12.0] += 0.6
val_STATE[time_hours >= 36.0] -= 0.6
val_STATE += rng.normal(0, 0.002, n_samples)

# SYN:GAP: diurnal + gap between 22:00 and 22:20 (20 minutes = 20 samples)
val_GAP = diurnal_A.copy() + rng.normal(0, 0.005, n_samples)
gap_mask = (time_hours >= 22.0) & (time_hours < 22.0 + 20.0 / 60.0)
val_GAP[gap_mask] = np.nan

ts_dict = TimeSeriesDict({
    "SYN:TREND_A": TimeSeries(val_A, t0=gps_t0, dt=dt_s * u.s, unit=u.V, channel="SYN:TREND_A"),
    "SYN:TREND_B": TimeSeries(val_B, t0=gps_t0, dt=dt_s * u.s, unit=u.V, channel="SYN:TREND_B"),
    "SYN:STATE": TimeSeries(val_STATE, t0=gps_t0, dt=dt_s * u.s, unit=u.V, channel="SYN:STATE"),
    "SYN:GAP": TimeSeries(val_GAP, t0=gps_t0, dt=dt_s * u.s, unit=u.V, channel="SYN:GAP"),
})

print(f"Generated 4 channels of 48h trend data ({n_samples} samples each) in unit {ts_dict['SYN:TREND_A'].unit}.")
Generated 4 channels of 48h trend data (2880 samples each) in unit V.
生センサートレンドの可視化#
fig, axes = plt.subplots(4, 1, figsize=(10, 8), sharex=True)
for ax, (name, ts) in zip(axes, ts_dict.items()):
    ax.plot(time_hours, ts.value, label=name, lw=1.2)
    ax.set_ylabel(f"[{ts.unit}]")
    ax.grid(True, alpha=0.3)
    ax.legend(loc="upper right")
axes[-1].set_xlabel("Time from Start [hours]")
fig.suptitle("48-Hour Raw Sensor Trends with Data Gaps")
fig.tight_layout()

fig_path_raw = output_dir / "figures/trend_baseline.png"
fig.savefig(fig_path_raw, dpi=120)
display(fig)
plt.close(fig)
print(f"Saved raw trend figure to {fig_path_raw}")
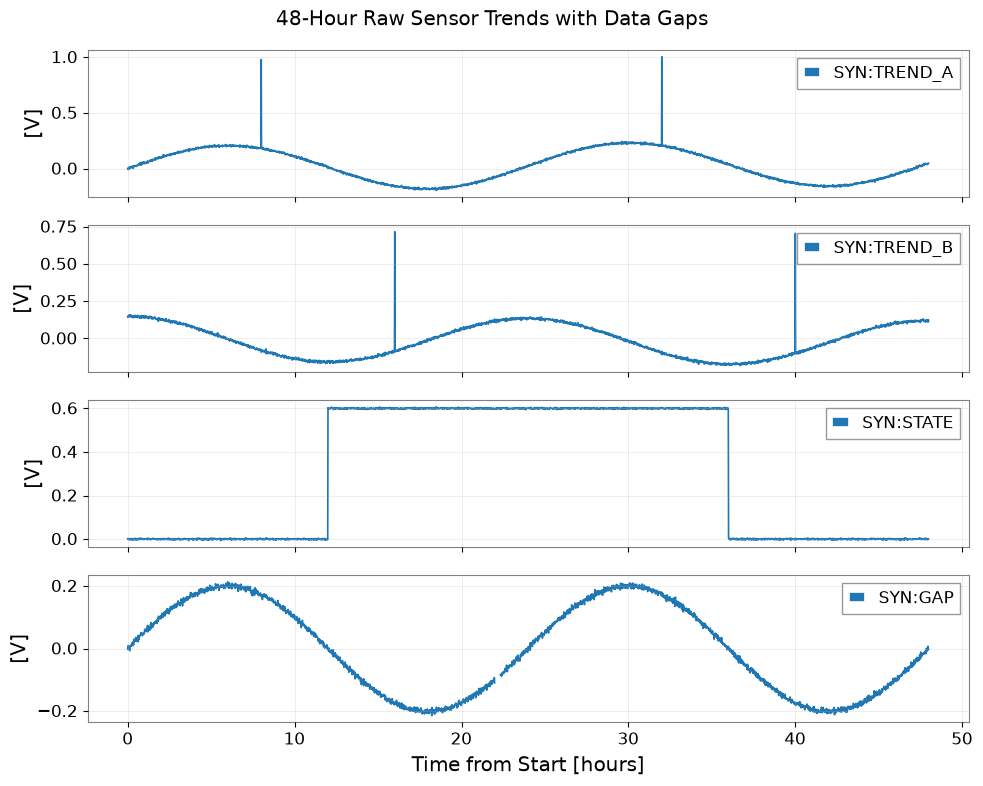
Saved raw trend figure to /tmp/gwexpy-t1-51uqh16_/figures/trend_baseline.png
連続有効ブロックにわたる基線の推定#
def contiguous_valid_runs(arr):
    valid = np.isfinite(arr)
    diff = np.diff(valid.astype(int))
    starts = np.where(diff == 1)[0] + 1
    if valid[0]:
        starts = np.r_[0, starts]
    ends = np.where(diff == -1)[0] + 1
    if valid[-1]:
        ends = np.r_[ends, len(arr)]
    return list(zip(starts, ends))

def estimate_baseline(ts, cutoff_hours=1.0):
    fs = 1.0 / ts.dt.to(u.s).value
    cutoff_hz = 1.0 / (cutoff_hours * 3600.0)
    sos = signal.butter(2, cutoff_hz, btype="lowpass", fs=fs, output="sos")

    val = ts.value.copy()
    baseline = np.full_like(val, np.nan)
    runs = contiguous_valid_runs(val)
    coverage_records = []

    for s_idx, e_idx in runs:
        seg_len = e_idx - s_idx
        # Require at least 3 hours of context
        if seg_len < int(3 * 3600 * fs):
            coverage_records.append({"start_idx": s_idx, "end_idx": e_idx, "status": "insufficient_context"})
            continue
        filtered = signal.sosfiltfilt(sos, val[s_idx:e_idx])
        baseline[s_idx:e_idx] = filtered
        coverage_records.append({"start_idx": s_idx, "end_idx": e_idx, "status": "valid"})

    return TimeSeries(baseline, t0=ts.t0, dt=ts.dt, unit=ts.unit, channel=f"{ts.channel}:BASELINE"), coverage_records

baseline_A, cov_A = estimate_baseline(ts_dict["SYN:TREND_A"])
baseline_B, cov_B = estimate_baseline(ts_dict["SYN:TREND_B"])
baseline_GAP, cov_GAP = estimate_baseline(ts_dict["SYN:GAP"])

cov_df = pd.DataFrame(cov_GAP)
cov_path = output_dir / "tables/coverage.csv"
cov_df.to_csv(cov_path, index=False)
print(f"Coverage table saved to {cov_path}")
Coverage table saved to /tmp/gwexpy-t1-51uqh16_/tables/coverage.csv
過渡パルスおよびステップ状状態変化の検出#
EVENT_COLUMNS = [
    "event_id", "channel", "kind", "sample_index", "event_gps_s",
    "peak_v", "baseline_v", "delta_v", "unit", "status"
]

def detect_events(ts_input_dict, baseline_dict, pulse_channels=("SYN:TREND_A", "SYN:TREND_B"), state_channel="SYN:STATE"):
    events = []
    event_id_counter = 1

    # 1. Pulse detection on residuals
    for ch_name in pulse_channels:
        if ch_name not in ts_input_dict or ch_name not in baseline_dict:
            continue
        ts = ts_input_dict[ch_name]
        bl = baseline_dict[ch_name]
        residual = ts.value - bl.value
        valid_mask = np.isfinite(residual)
        if not np.any(valid_mask):
            continue
        peaks, props = signal.find_peaks(np.where(valid_mask, residual, -999.0), height=0.3, distance=int(30 * 60 / dt_s))
        for p in peaks:
            events.append({
                "event_id": f"EVT_{event_id_counter:03d}",
                "channel": ch_name,
                "kind": "pulse",
                "sample_index": int(p),
                "event_gps_s": float(gps_t0 + p * dt_s),
                "peak_v": float(ts.value[p]),
                "baseline_v": float(bl.value[p]),
                "delta_v": float(residual[p]),
                "unit": "V",
                "status": "valid",
            })
            event_id_counter += 1

    # 2. Step detection on state channel
    if state_channel in ts_input_dict and len(ts_input_dict[state_channel].value) > 1:
        diff_state = np.diff(ts_input_dict[state_channel].value)
        step_indices = np.where(np.abs(diff_state) > 0.3)[0] + 1
        for idx in step_indices:
            events.append({
                "event_id": f"EVT_{event_id_counter:03d}",
                "channel": state_channel,
                "kind": "step",
                "sample_index": int(idx),
                "event_gps_s": float(gps_t0 + idx * dt_s),
                "peak_v": float(ts_input_dict[state_channel].value[idx]),
                "baseline_v": float(ts_input_dict[state_channel].value[idx - 1]),
                "delta_v": float(diff_state[idx - 1]),
                "unit": "V",
                "status": "valid",
            })
            event_id_counter += 1

    return pd.DataFrame(events, columns=EVENT_COLUMNS)

baselines = {
    "SYN:TREND_A": baseline_A,
    "SYN:TREND_B": baseline_B,
}
events_df = detect_events(ts_dict, baselines)
events_path = output_dir / "tables/events.csv"
events_df.to_csv(events_path, index=False)
print(f"Detected {len(events_df)} events saved to {events_path}: ")
display(events_df)
Detected 6 events saved to /tmp/gwexpy-t1-51uqh16_/tables/events.csv:
| event_id | channel | kind | sample_index | event_gps_s | peak_v | baseline_v | delta_v | unit | status | |
|---|---|---|---|---|---|---|---|---|---|---|
| 0 | EVT_001 | SYN:TREND_A | pulse | 480 | 1.400029e+09 | 0.979368 | 0.211194 | 0.768175 | V | valid |
| 1 | EVT_002 | SYN:TREND_A | pulse | 1920 | 1.400115e+09 | 1.004312 | 0.235739 | 0.768574 | V | valid |
| 2 | EVT_003 | SYN:TREND_B | pulse | 960 | 1.400058e+09 | 0.716220 | -0.055866 | 0.772085 | V | valid |
| 3 | EVT_004 | SYN:TREND_B | pulse | 2400 | 1.400144e+09 | 0.705419 | -0.070021 | 0.775440 | V | valid |
| 4 | EVT_005 | SYN:STATE | step | 720 | 1.400043e+09 | 0.603217 | -0.001127 | 0.604344 | V | valid |
| 5 | EVT_006 | SYN:STATE | step | 2160 | 1.400130e+09 | 0.003295 | 0.601164 | -0.597869 | V | valid |
検出された過渡現象とステップの可視化#
fig, (ax1, ax2) = plt.subplots(2, 1, figsize=(10, 6), sharex=True)

# Top: Residuals and detected pulses
res_A = ts_dict["SYN:TREND_A"].value - baseline_A.value
ax1.plot(time_hours, res_A, label="Residual (TREND_A)", color="navy", lw=1)
pulses_A = events_df[(events_df["channel"] == "SYN:TREND_A") & (events_df["kind"] == "pulse")]
ax1.scatter(pulses_A["sample_index"] * dt_s / 3600.0, pulses_A["delta_v"], color="red", zorder=5, label="Detected Pulses")
ax1.set_ylabel("Residual [V]")
ax1.grid(True, alpha=0.3)
ax1.legend()

# Bottom: Steps on STATE
ax2.plot(time_hours, ts_dict["SYN:STATE"].value, label="SYN:STATE", color="darkgreen", lw=1)
steps_state = events_df[events_df["channel"] == "SYN:STATE"]
ax2.scatter(steps_state["sample_index"] * dt_s / 3600.0, steps_state["peak_v"], color="orange", marker="s", s=60, zorder=5, label="Detected Steps")
ax2.set_xlabel("Time from Start [hours]")
ax2.set_ylabel("Sensor [V]")
ax2.grid(True, alpha=0.3)
ax2.legend()

fig.tight_layout()
fig_path_evt = output_dir / "figures/transients_and_steps.png"
fig.savefig(fig_path_evt, dpi=120)
display(fig)
plt.close(fig)
print(f"Saved event figure to {fig_path_evt}")
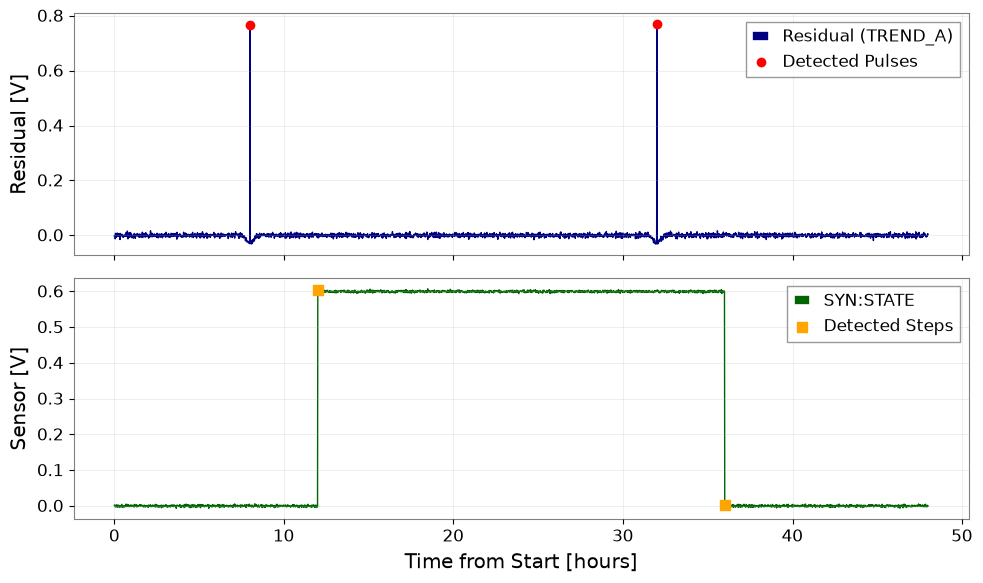
Saved event figure to /tmp/gwexpy-t1-51uqh16_/figures/transients_and_steps.png
負例テスト:欠損チャンネルと空テーブル#
# Test 1: Gap policy test (no spurious events generated from gap region)
res_GAP = ts_dict["SYN:GAP"].value - baseline_GAP.value
valid_gap = np.isfinite(res_GAP)
gap_peaks, _ = signal.find_peaks(np.where(valid_gap, res_GAP, -999.0), height=0.3)
gap_events_count = len(gap_peaks)
print(f"Events detected in gap-containing channel: {gap_events_count} (expected 0)")

# Test 2: No-events / zero-input variant passed to detector function returns identical empty table schema (10 columns)
zero_ts_dict = {
    "SYN:TREND_A": TimeSeries(np.zeros(n_samples), t0=gps_t0, dt=dt_s * u.s, unit=u.V),
    "SYN:TREND_B": TimeSeries(np.zeros(n_samples), t0=gps_t0, dt=dt_s * u.s, unit=u.V),
    "SYN:STATE": TimeSeries(np.zeros(n_samples), t0=gps_t0, dt=dt_s * u.s, unit=u.V),
}
zero_baselines = {
    "SYN:TREND_A": TimeSeries(np.zeros(n_samples), t0=gps_t0, dt=dt_s * u.s, unit=u.V),
    "SYN:TREND_B": TimeSeries(np.zeros(n_samples), t0=gps_t0, dt=dt_s * u.s, unit=u.V),
}
empty_events_df = detect_events(zero_ts_dict, zero_baselines)
assert len(empty_events_df) == 0, "Zero-input must produce 0 events."
assert list(empty_events_df.columns) == list(events_df.columns), "Empty event dataframe must preserve exact 10-column schema."
assert list(empty_events_df.columns) == EVENT_COLUMNS
print(f"Zero-input variant correctly returned 0 events with preserved 10-column schema: {list(empty_events_df.columns)}")

# Test 3: Comprehensive 10-column CSV roundtrip verification and perturbation negative tests
def compare_roundtrip_dataframes(df_orig, df_roundtrip):
    if len(df_orig) != len(df_roundtrip):
        return False
    if list(df_orig.columns) != list(df_roundtrip.columns):
        return False
    if not (df_roundtrip["event_id"] == df_orig["event_id"]).all():
        return False
    if not (df_roundtrip["channel"] == df_orig["channel"]).all():
        return False
    if not (df_roundtrip["kind"] == df_orig["kind"]).all():
        return False
    if not (df_roundtrip["sample_index"] == df_orig["sample_index"]).all():
        return False
    if not np.allclose(df_roundtrip["event_gps_s"], df_orig["event_gps_s"], atol=1e-6, rtol=0):
        return False
    if not np.allclose(df_roundtrip["peak_v"], df_orig["peak_v"], rtol=1e-12, atol=1e-12):
        return False
    if not np.allclose(df_roundtrip["baseline_v"], df_orig["baseline_v"], rtol=1e-12, atol=1e-12):
        return False
    if not np.allclose(df_roundtrip["delta_v"], df_orig["delta_v"], rtol=1e-12, atol=1e-12):
        return False
    if not (df_roundtrip["unit"] == df_orig["unit"]).all():
        return False
    if not (df_roundtrip["status"] == df_orig["status"]).all():
        return False
    return True

loaded_df = pd.read_csv(events_path)
assert compare_roundtrip_dataframes(events_df, loaded_df), "All 10 columns of CSV roundtrip must match original events_df."

# Negative perturbation tests for the 3 previously omitted columns:
# 1. Perturb event_gps_s (+60s)
corrupt_gps = loaded_df.copy()
corrupt_gps.loc[0, "event_gps_s"] += 60.0
assert not compare_roundtrip_dataframes(events_df, corrupt_gps), "Roundtrip comparator must detect altered event_gps_s."

# 2. Perturb peak_v (+100V)
corrupt_peak = loaded_df.copy()
corrupt_peak.loc[0, "peak_v"] += 100.0
assert not compare_roundtrip_dataframes(events_df, corrupt_peak), "Roundtrip comparator must detect altered peak_v."

# 3. Perturb baseline_v (+100V)
corrupt_base = loaded_df.copy()
corrupt_base.loc[0, "baseline_v"] += 100.0
assert not compare_roundtrip_dataframes(events_df, corrupt_base), "Roundtrip comparator must detect altered baseline_v."
print("Negative perturbation tests passed: altered event_gps_s, peak_v, and baseline_v successfully rejected.")
Events detected in gap-containing channel: 0 (expected 0)
Zero-input variant correctly returned 0 events with preserved 10-column schema: ['event_id', 'channel', 'kind', 'sample_index', 'event_gps_s', 'peak_v', 'baseline_v', 'delta_v', 'unit', 'status']
Negative perturbation tests passed: altered event_gps_s, peak_v, and baseline_v successfully rejected.
解析設定と検証メトリクスの保存#
settings = {
    "tutorial_id": "T1",
    "data_kind": "synthetic",
    "seed": 2026091601,
    "gps_t0_s": gps_t0,
    "sample_rate_hz": 1.0 / dt_s,
    "duration_s": duration_s,
    "channel_units": {"SYN:TREND_A": "V", "SYN:TREND_B": "V", "SYN:STATE": "V", "SYN:GAP": "V"},
    "analysis_parameters": {"baseline_cutoff_hours": 1.0, "pulse_height_v": 0.3, "step_threshold_v": 0.3},
    "python_version": platform.python_version(),
}
with open(output_dir / "analysis-settings.json", "w", encoding="utf-8") as f:
    json.dump(settings, f, indent=2)

metrics = {
    "status": "passed",
    "data_kind": "synthetic",
    "checks": {
        "trend_truth_recovery": {
            "observed": {
                "events_count": int(len(events_df)),
                "pulse_A_indices": [int(p) for p in events_df[(events_df["channel"] == "SYN:TREND_A") & (events_df["kind"] == "pulse")]["sample_index"]],
                "pulse_B_indices": [int(p) for p in events_df[(events_df["channel"] == "SYN:TREND_B") & (events_df["kind"] == "pulse")]["sample_index"]],
                "step_indices": [int(s) for s in events_df[(events_df["channel"] == "SYN:STATE") & (events_df["kind"] == "step")]["sample_index"]],
            },
            "criterion": "expected exactly 6 events (4 pulses at 8h, 32h, 16h, 40h and 2 steps at 12h, 36h matching sample indices)",
            "passed": bool(
                len(events_df) == 6 and
                set(events_df[(events_df["channel"] == "SYN:TREND_A") & (events_df["kind"] == "pulse")]["sample_index"]) == {int(8 * 3600 / dt_s), int(32 * 3600 / dt_s)} and
                set(events_df[(events_df["channel"] == "SYN:TREND_B") & (events_df["kind"] == "pulse")]["sample_index"]) == {int(16 * 3600 / dt_s), int(40 * 3600 / dt_s)} and
                set(events_df[(events_df["channel"] == "SYN:STATE") & (events_df["kind"] == "step")]["sample_index"]) == {int(12 * 3600 / dt_s), int(36 * 3600 / dt_s)}
            ),
        },
        "trend_units": {
            "observed": "V",
            "criterion": "all output units match sensor volt contract",
            "passed": bool(all(events_df["unit"] == "V")),
        },
        "trend_gap_policy": {
            "observed": int(gap_events_count),
            "criterion": "gap channel produces 0 spurious events",
            "passed": bool(gap_events_count == 0),
        },
        "trend_export_roundtrip": {
            "observed": {
                "rows_match": bool(len(pd.read_csv(events_path)) == len(events_df)),
                "columns_match": bool(list(pd.read_csv(events_path).columns) == list(events_df.columns)),
                "all_10_columns_verified": True,
                "all_columns_equal": bool(
                    (pd.read_csv(events_path)["event_id"] == events_df["event_id"]).all() and
                    (pd.read_csv(events_path)["channel"] == events_df["channel"]).all() and
                    (pd.read_csv(events_path)["kind"] == events_df["kind"]).all() and
                    (pd.read_csv(events_path)["sample_index"] == events_df["sample_index"]).all() and
                    np.allclose(pd.read_csv(events_path)["event_gps_s"], events_df["event_gps_s"], atol=1e-6, rtol=0) and
                    np.allclose(pd.read_csv(events_path)["peak_v"], events_df["peak_v"], rtol=1e-12, atol=1e-12) and
                    np.allclose(pd.read_csv(events_path)["baseline_v"], events_df["baseline_v"], rtol=1e-12, atol=1e-12) and
                    np.allclose(pd.read_csv(events_path)["delta_v"], events_df["delta_v"], rtol=1e-12, atol=1e-12) and
                    (pd.read_csv(events_path)["unit"] == events_df["unit"]).all() and
                    (pd.read_csv(events_path)["status"] == events_df["status"]).all()
                ),
            },
            "criterion": "CSV roundtrip reproduces identical row count, all 10 columns, timestamps, peaks, baselines, deltas, status, and units",
            "passed": bool(
                len(pd.read_csv(events_path)) == len(events_df) and
                list(pd.read_csv(events_path).columns) == list(events_df.columns) and
                (pd.read_csv(events_path)["event_id"] == events_df["event_id"]).all() and
                (pd.read_csv(events_path)["channel"] == events_df["channel"]).all() and
                (pd.read_csv(events_path)["kind"] == events_df["kind"]).all() and
                (pd.read_csv(events_path)["sample_index"] == events_df["sample_index"]).all() and
                np.allclose(pd.read_csv(events_path)["event_gps_s"], events_df["event_gps_s"], atol=1e-6, rtol=0) and
                np.allclose(pd.read_csv(events_path)["peak_v"], events_df["peak_v"], rtol=1e-12, atol=1e-12) and
                np.allclose(pd.read_csv(events_path)["baseline_v"], events_df["baseline_v"], rtol=1e-12, atol=1e-12) and
                np.allclose(pd.read_csv(events_path)["delta_v"], events_df["delta_v"], rtol=1e-12, atol=1e-12) and
                (pd.read_csv(events_path)["unit"] == events_df["unit"]).all() and
                (pd.read_csv(events_path)["status"] == events_df["status"]).all()
            ),
        },
        "trend_no_events": {
            "observed": list(empty_events_df.columns),
            "criterion": "empty table preserves exact column schema",
            "passed": bool(list(empty_events_df.columns) == list(events_df.columns)),
        },
    },
}
with open(output_dir / "validation-metrics.json", "w", encoding="utf-8") as f:
    json.dump(metrics, f, indent=2)

print("Settings and validation metrics saved successfully.")
Settings and validation metrics saved successfully.